seaborn-qqplot
seaborn-qqplot is a seaborn extension adding qqplots.
User’s Guide
Requirements
seaborn-qqplot is build on top of the following libraries:
- Numpy (http://www.numpy.org)
- SciPy (http://www.scipy.org)
- Pandas (http://pandas.pydata.org/)
- matplotlib (http://http://matplotlib.org/)
- Seaborn (http://http://matplotlib.org/)
Issues
Should you encounter any issue with the library you can raise them here: https://github.com/ronsenbergVI/seaborn-qqplot/issues
Quickstart
A simple qq-plot comparing the iris dataset petal length and sepal length distributions can be done as follows:
>>> import seaborn as sns
>>> from seaborn_qqplot import pplot
>>> iris = sns.load_dataset('iris')
>>> pplot(iris, x="petal_length", y="sepal_length", kind='qq')
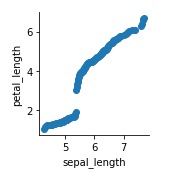
simple qqplot
The sizes can be changed with the height and aspect parameters. The height can be fixed directly and the aspect will set the width in relation to the height:
>>> pplot(iris, x="sepal_length", y="petal_length", kind='qq', height=4, aspect=2)
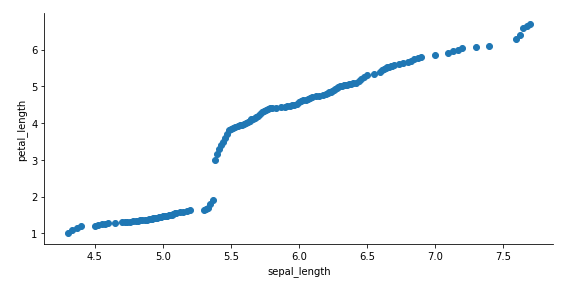
simple qqplot - size altered
While performing exploratory data analysis (seaborn had become quite popular to perform such taks), it is very informative to display the change in the underlying distribution of a variable for a given label:
>>> pplot(iris, x="sepal_length", y="petal_length", hue="species", kind='qq', height=4, aspect=2)
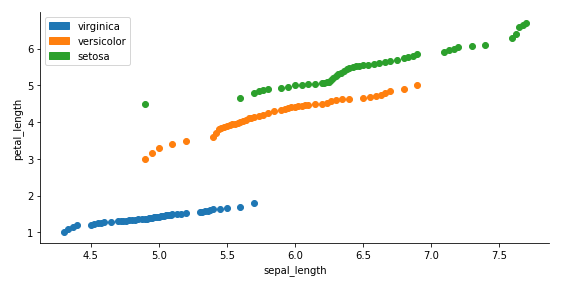
qqplot with hue
seaborn-qqplot also allows to compare a variable to a known probability distribution. The extension only supports scipy.rv_continuous random variable models:
>>> from scipy.stats import gamma
>>> pplot(iris, x="sepal_length", y=gamma, hue="species", kind='qq', height=4, aspect=2)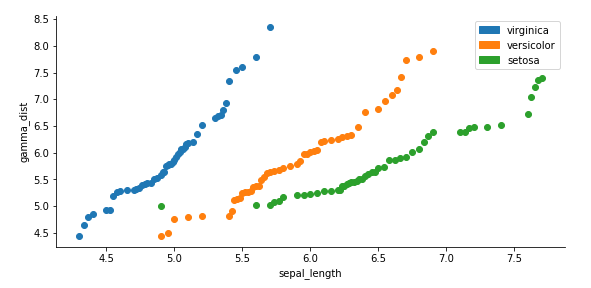
gamma qqplot for the sepal_length variable
A qqplot with 2 samples from the same distribution will display points close to the x=y line thus it is possible to add the identity line as a graphical diagnostic:
>>> pplot(iris, x="sepal_length", y=gamma, hue="species", kind='qq', height=4, aspect=2, display_kws={"identity":True})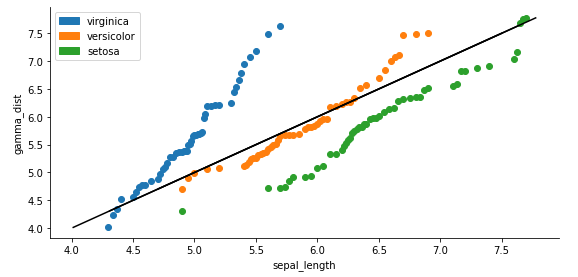
gamma qqplot for the sepal_length variable with identity line
Another graphical aid is to add regression lines for the qqplot points:
>>> pplot(iris, x="sepal_length", y="petal_length", hue="species", kind='qq', height=4, aspect=2, display_kws={"identity":False, "fit":True})
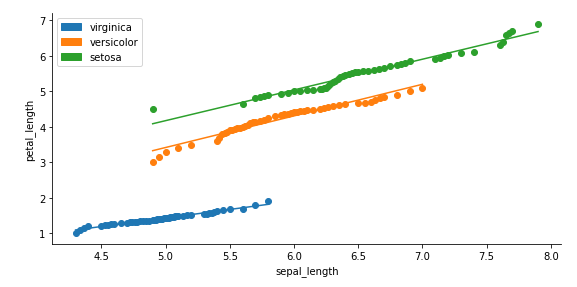
gamma qqplot for the sepal_length variable with regression lines
Finally, confidence intervals can be added for the linear regressions, we can precise the degree of confidence of the interval with the parameter ci a number in the interval [0,1] and the confidence intervals with degree of confidence 1 - ci/2 will be displayed:
>>> pplot(iris, x="sepal_length", y=gamma, hue="species", kind='qq', height=4, aspect=2, display_kws={"identity":False, "fit":True, "reg":True, "ci":0.025})
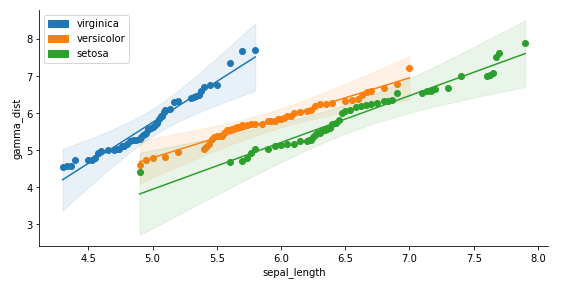
gamma qqplot for the sepal_length variable with regression lines
Seaborn-qqplot Changelog
We detail here the changes made to the library
Version 0.4.0
Release day: June 20 2020
- revamped API
- cleaned code with better abstractions
- quantile, probability, qq and pp plots support
Version 0.3.2
Release day: August 08 2019
- import error: missing import for the Student’s t distribution.
Version 0.3.1
Release day: July 01 2019
- fixed missing elements in legend
- removed tests (seaborn is already proved with tests - some extra might be added in future releases)
License
seaborn-qqplot is licensed under the BSD 3-Clause License. It means that the source code provided in the binaries can be used, modified, or distributed freely for commercial or personal use with conditions only requiring preservation of copyright and license notices.
The full license text can be found below (seaborn-qqplot-license).
Authors
seaborn-qqplot is written and maintained by Rene-Jean Corneille
Contributing
I am still working on this section but contribution is welcome.
Report Bugs
Report bugs at https://github.com/ronsenbergvi/seaborn-qqplot/issues.
License Definitions
The following section contains the full license texts for seaborn-qqplot and the documentation.
- “AUTHORS” hereby refers to all the authors listed in the authors section.
- The “seaborn-qqplot-license” applies to all the source code shipped as part of seaborn-qqplot (seaborn-qqplot itself as well as the examples and the unittests) as well as documentation.
seaborn-qqplot License
BSD 3-Clause License
Copyright (c) 2019, Rene Jean Corneille All rights reserved.
Redistribution and use in source and binary forms, with or without modification, are permitted provided that the following conditions are met:
- Redistributions of source code must retain the above copyright notice, this list of conditions and the following disclaimer.
- Redistributions in binary form must reproduce the above copyright notice, this list of conditions and the following disclaimer in the documentation and/or other materials provided with the distribution.
- Neither the name of the copyright holder nor the names of its contributors may be used to endorse or promote products derived from this software without specific prior written permission.
THIS SOFTWARE IS PROVIDED BY THE COPYRIGHT HOLDERS AND CONTRIBUTORS “AS IS” AND ANY EXPRESS OR IMPLIED WARRANTIES, INCLUDING, BUT NOT LIMITED TO, THE IMPLIED WARRANTIES OF MERCHANTABILITY AND FITNESS FOR A PARTICULAR PURPOSE ARE DISCLAIMED. IN NO EVENT SHALL THE COPYRIGHT HOLDER OR CONTRIBUTORS BE LIABLE FOR ANY DIRECT, INDIRECT, INCIDENTAL, SPECIAL, EXEMPLARY, OR CONSEQUENTIAL DAMAGES (INCLUDING, BUT NOT LIMITED TO, PROCUREMENT OF SUBSTITUTE GOODS OR SERVICES; LOSS OF USE, DATA, OR PROFITS; OR BUSINESS INTERRUPTION) HOWEVER CAUSED AND ON ANY THEORY OF LIABILITY, WHETHER IN CONTRACT, STRICT LIABILITY, OR TORT (INCLUDING NEGLIGENCE OR OTHERWISE) ARISING IN ANY WAY OUT OF THE USE OF THIS SOFTWARE, EVEN IF ADVISED OF THE POSSIBILITY OF SUCH DAMAGE.